This guide shows you how to monitor your current disk space and bandwidth consumption in Plesk. Checking these statistics regularly helps you stay within your hosting plan limits and identify potential resource issues before they affect your websites.
How to Check Usage Statistics
-
Step 1: Log in to Plesk
Access your Plesk account by navigating to your Plesk login URL, typically in the format
https://example.com:8443. Enter your username and password when prompted. If you've set up two-factor authentication (2FA), ensure you have that ready as well. -
Step 2: Open the Statistics section
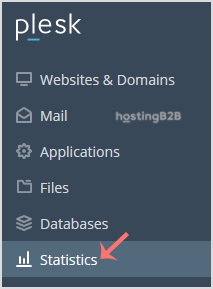
In the sidebar menu, click on Statistics. This section provides an overview of your server's performance and resource usage. The exact layout might vary slightly depending on your Plesk version, but generally, you'll find a similar structure.
-
Step 3: Review disk and bandwidth usage
On the Statistics page, you'll find disk usage information on the left side and traffic/bandwidth usage on the right side. The disk usage section will show how much space your websites, databases, and other files are using, along with a breakdown of each component.
Scroll down to view detailed information including FTP statistics, data transfer metrics, and web statistics. You can also click on specific sections for more granular details. For instance, clicking on "Web Statistics" will provide you with insights into your website's traffic sources, visitor numbers, and page views.
Tips:
- Regularly check your usage statistics to ensure you are not approaching or exceeding your hosting plan limits. This can help prevent service disruptions.
- To manage disk space, consider optimizing images and other media files, removing unnecessary files, and archiving old content.
- If you find that your bandwidth usage is consistently high, look into optimizing your website's performance or consider upgrading to a higher-tier hosting plan if necessary.